Back to Article
Weather
Download Source

Weather

Author

Alex Koiter

Load Libraries

In [1]:
library(tidyverse)
── Attaching core tidyverse packages ──────────────────────── tidyverse 2.0.0 ──
✔ dplyr     1.1.4     ✔ readr     2.1.5
✔ forcats   1.0.0     ✔ stringr   1.5.1
✔ ggplot2   3.5.1     ✔ tibble    3.2.1
✔ lubridate 1.9.3     ✔ tidyr     1.3.1
✔ purrr     1.0.2     
── Conflicts ────────────────────────────────────────── tidyverse_conflicts() ──
✖ dplyr::filter() masks stats::filter()
✖ dplyr::lag()    masks stats::lag()
ℹ Use the conflicted package (<http://conflicted.r-lib.org/>) to force all conflicts to become errors
library(readxl)
library(janitor)

Attaching package: 'janitor'

The following objects are masked from 'package:stats':

    chisq.test, fisher.test

Read in data

In [2]:
data <- read_excel("Forrest-Daily-TempRainSoil-20192021-AKoiter.xlsx") %>%
  clean_names() %>%
  mutate(date = ymd(date),
         year = year(date),
         month = month(date)) %>%
  filter(month >4, month < 11) 

precip data

In [3]:
precip <- data %>%
  group_by(year) %>%
  mutate(cumu_precip = cumsum(pluvio_rain)) %>%
  select(date, cumu_precip, pluvio_rain, year)
In [4]:
ggplot(data = data, aes(x = date, y = avg_air_t)) +
  geom_point() +
  theme_bw() +
  facet_wrap(~year, scales = "free_x")

ggplot(data = precip, aes(x = date, y = cumu_precip)) +
  geom_point() +
  theme_bw() +
  facet_wrap(~year, scales = "free_x")

Sampling dates

In [5]:
sampling <- tribble(
  ~year,    ~start,                 ~end,                    ~ymin, ~ymax,
  2019,   as_date("2019-09-03"),  as_date("2019-09-15"),   -Inf,    Inf,
  2020,   as_date("2020-09-09"),  as_date("2020-09-21"),   -Inf,    Inf,
  2021,   as_date("2021-09-04"),  as_date("2021-09-16"),   -Inf,    Inf)
In [6]:

ggplot() + 
  theme_bw() +
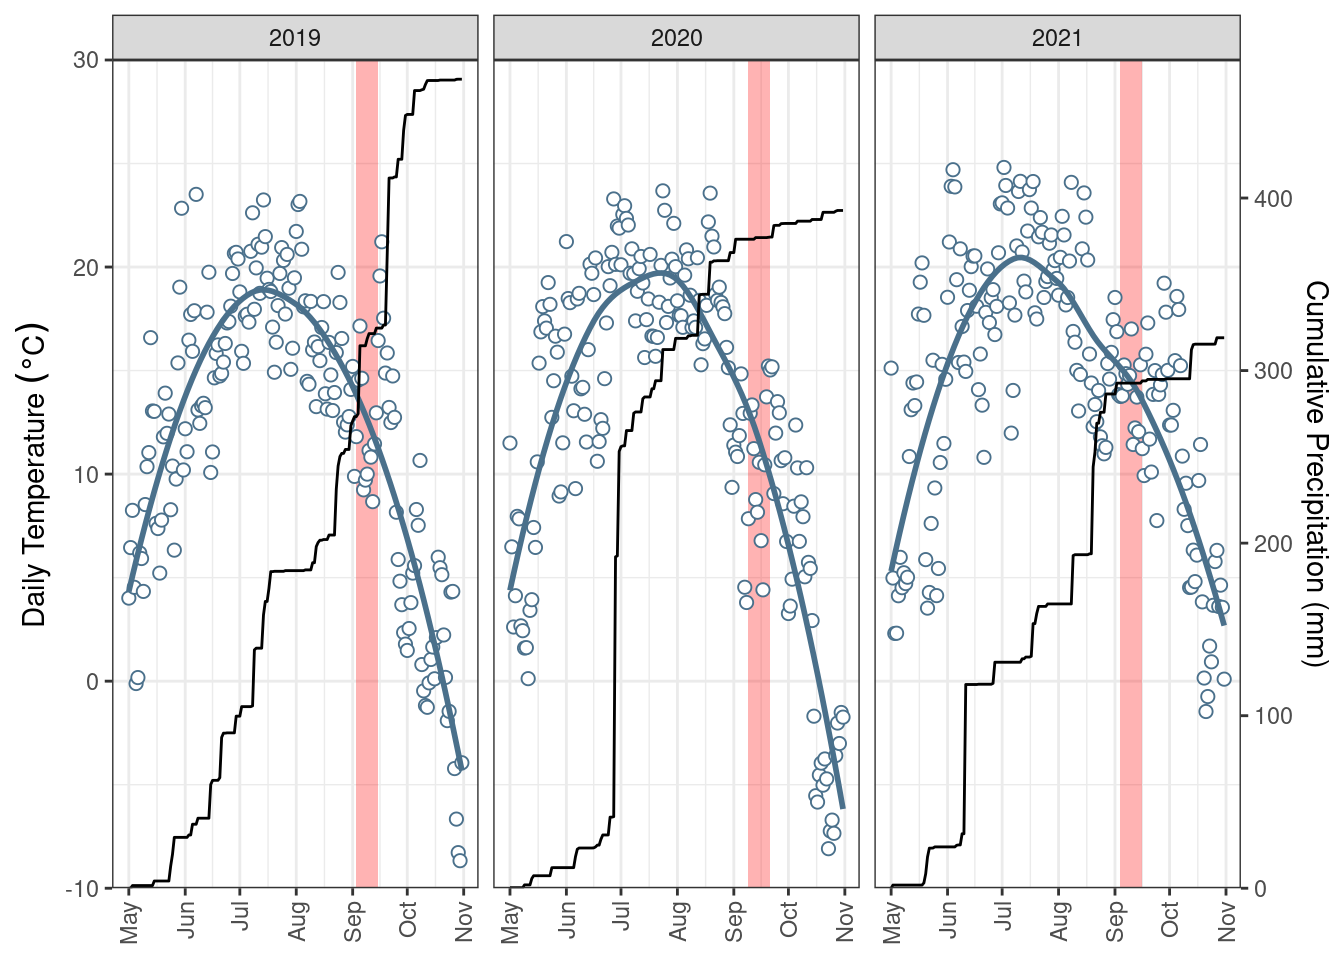
  geom_rect(data = sampling, aes(xmin = start, xmax = end, ymin = ymin, ymax = ymax), alpha = 0.3, fill = "red") +
  geom_point(data = data, aes(x = date, y = avg_air_t), colour = "skyblue4", size = 2,  shape = 21, fill = "white") + 
  stat_smooth(data = data, aes(x = date, y = avg_air_t), method = "loess", se = FALSE, colour = "skyblue4", linewidth = 1) +
  geom_line(data = precip, aes(x = date, y = cumu_precip/12 -10), colour = "black") +
  scale_y_continuous(name = expression("Daily Temperature " ( degree*C)), 
                     sec.axis = sec_axis(~ (. + 10) * 12 , name = "Cumulative Precipitation (mm)"),
                     limits = c(-10, 30),
                     expand = c(0, 0)) +
  scale_x_date(date_labels = "%b", 
               date_breaks = "1 month", 
               expand = c(0.05,0.05)) +
  theme(axis.text.x = element_text(angle = 90, vjust = 0.5, hjust = 1),
        axis.title.x = element_blank()) +
  facet_wrap(~year, scale = "free_x")
`geom_smooth()` using formula = 'y ~ x'

Average daily air temperature (blue) and cumulative rainfall (black) over the growing season over the three year study. Red bars indicate sampling dates

Average daily air temperature and cumulative rainfall over the growing season over the three year study. Red bars indicate sampling dates